
See EV heterogeneity in your PBA data
EVisualizer® is a free, interactive viewer that turns processed PBA data into a visual map of individual extracellular vesicles. Compare samples, find EV subpopulations and explore protein co-localization without writing code.
Free for everyone, included with every PBA project
EVisualizer® is free for anyone to use and works directly with data from Vesicode® kits and our EV Profiling Service. Open your project file in the browser to explore results at single-EV resolution and move from data to biological insight faster.
Find EV subpopulations
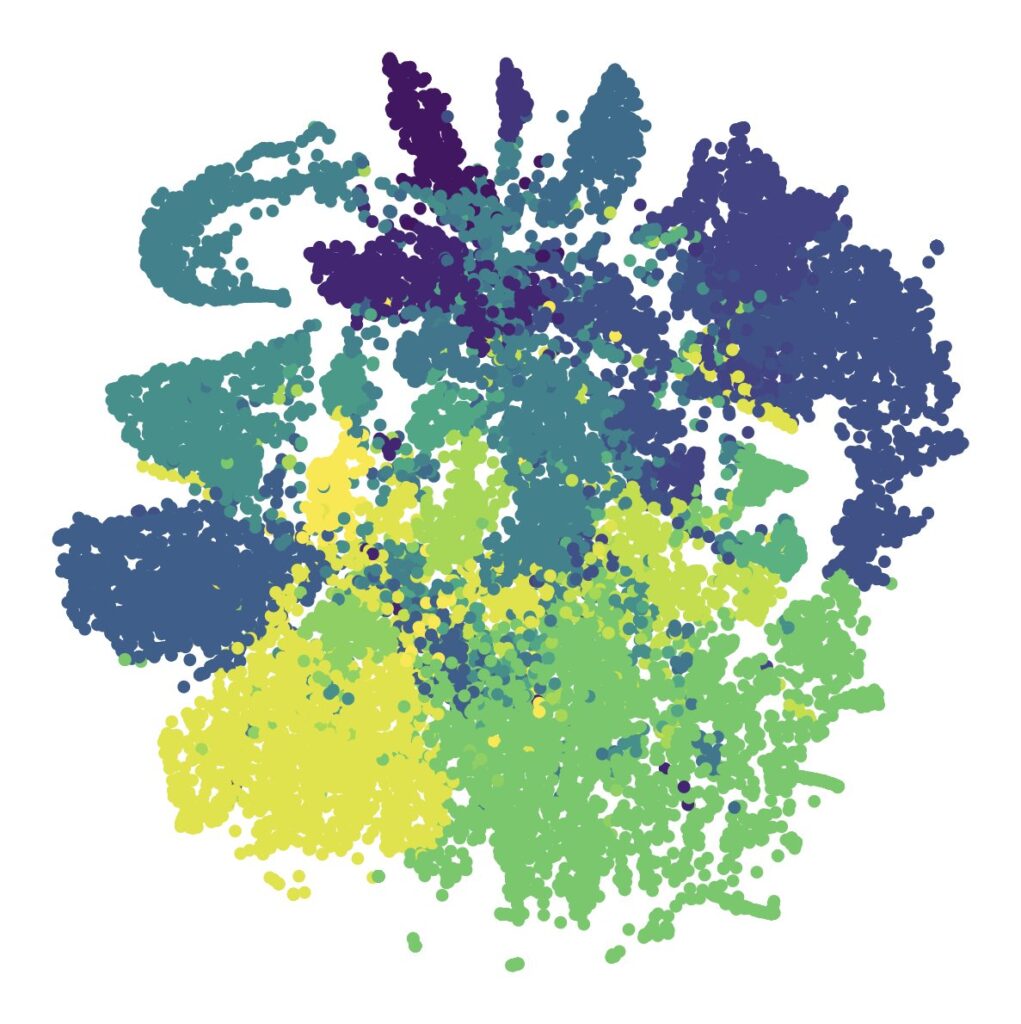
EVisualizer® groups individual EVs into clusters based on their protein profiles, so you can see the subpopulations in your dataset at a glance. Select any cluster to examine its composition in more detail.
Compare samples and groups
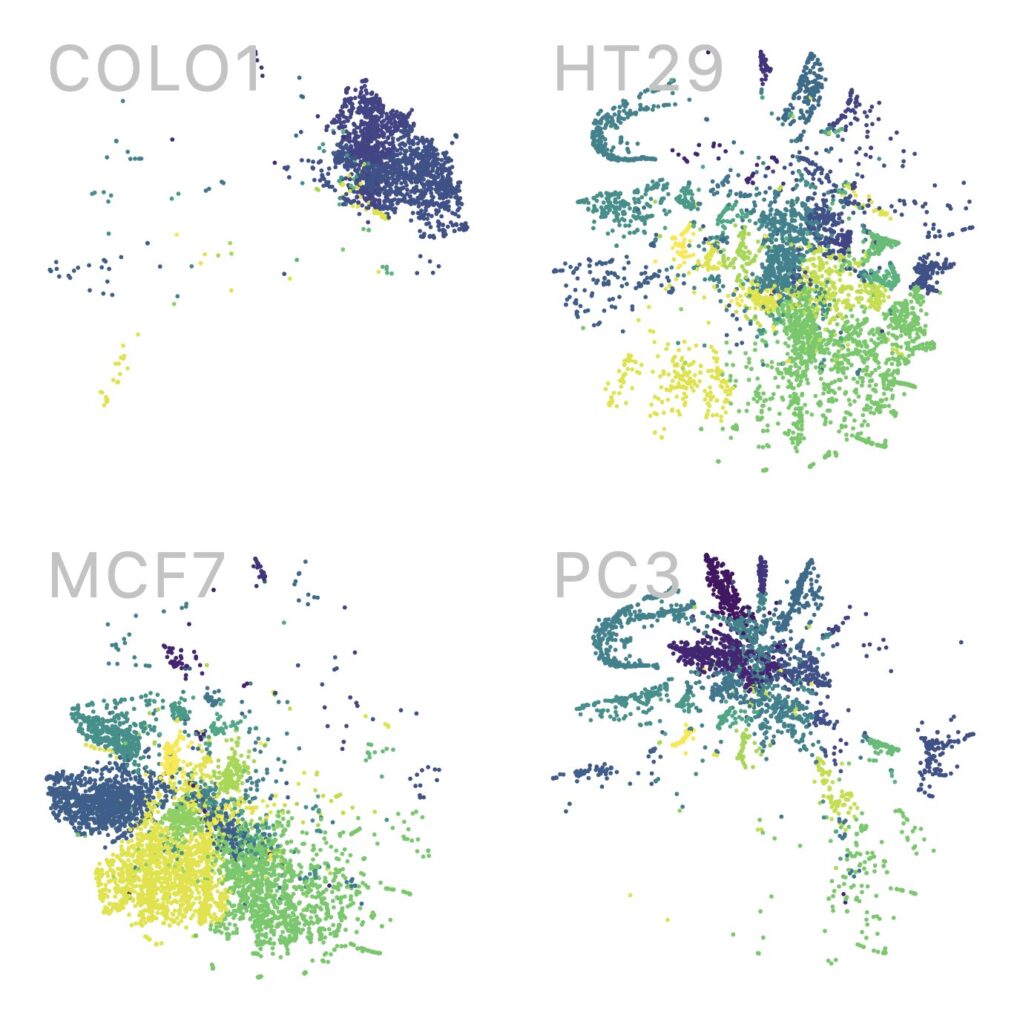
Switch to the Groups view to see EV profiles side by side for each sample group. Differences in cluster composition between conditions, timepoints or cohorts become visible immediately.
Explore co-localization
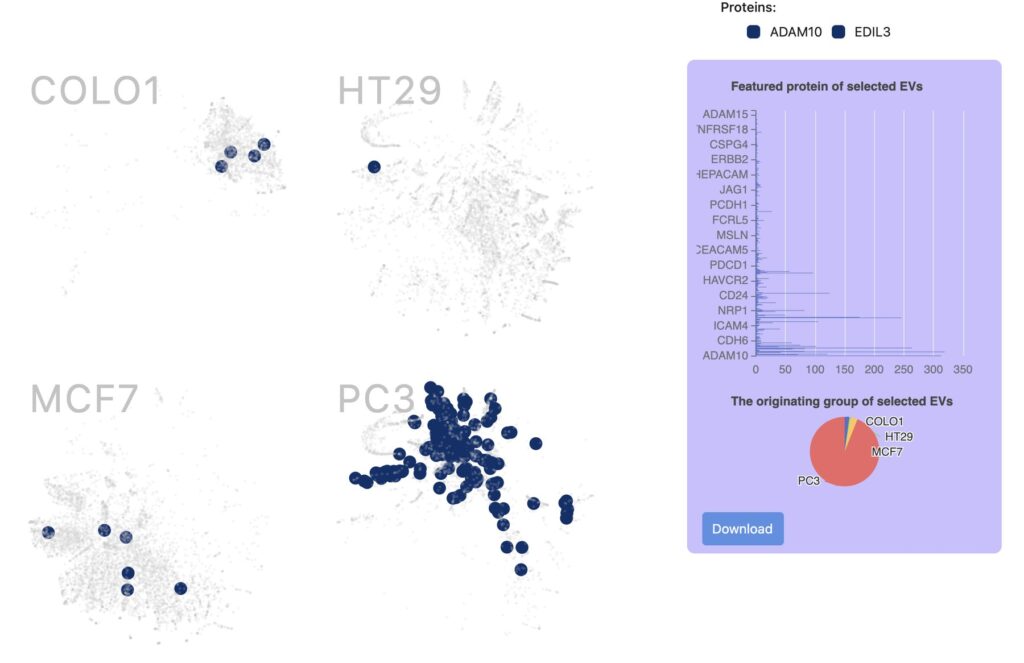
Select two or more proteins to highlight EVs that carry all of them, or any of them. The side panel shows which other proteins those EVs carry and which group they come from.
From sample to insight
-
Run a Vesicode® kit or send samples to our EV Profiling Service.
-
Sequencing and data processing.
-
Receive your EVisualizer® project file.
-
Explore, compare and share.
Ready to see your EVs in context?
Start a PBA project, or talk to our team about data analysis.