
Explore single-EV PBA data interactively
EVisualizer® is an interactive online viewer for exploring processed single-EV PBA data. Compare samples and groups, identify EV populations of interest, and investigate protein-defined molecular features through an intuitive visual interface.
From processed PBA data to focused exploration
EVisualizer® transforms processed PBA data into an interactive visual environment. Compare samples and groups, identify EV populations of interest, and examine hownselected proteins are distributed across the dataset.
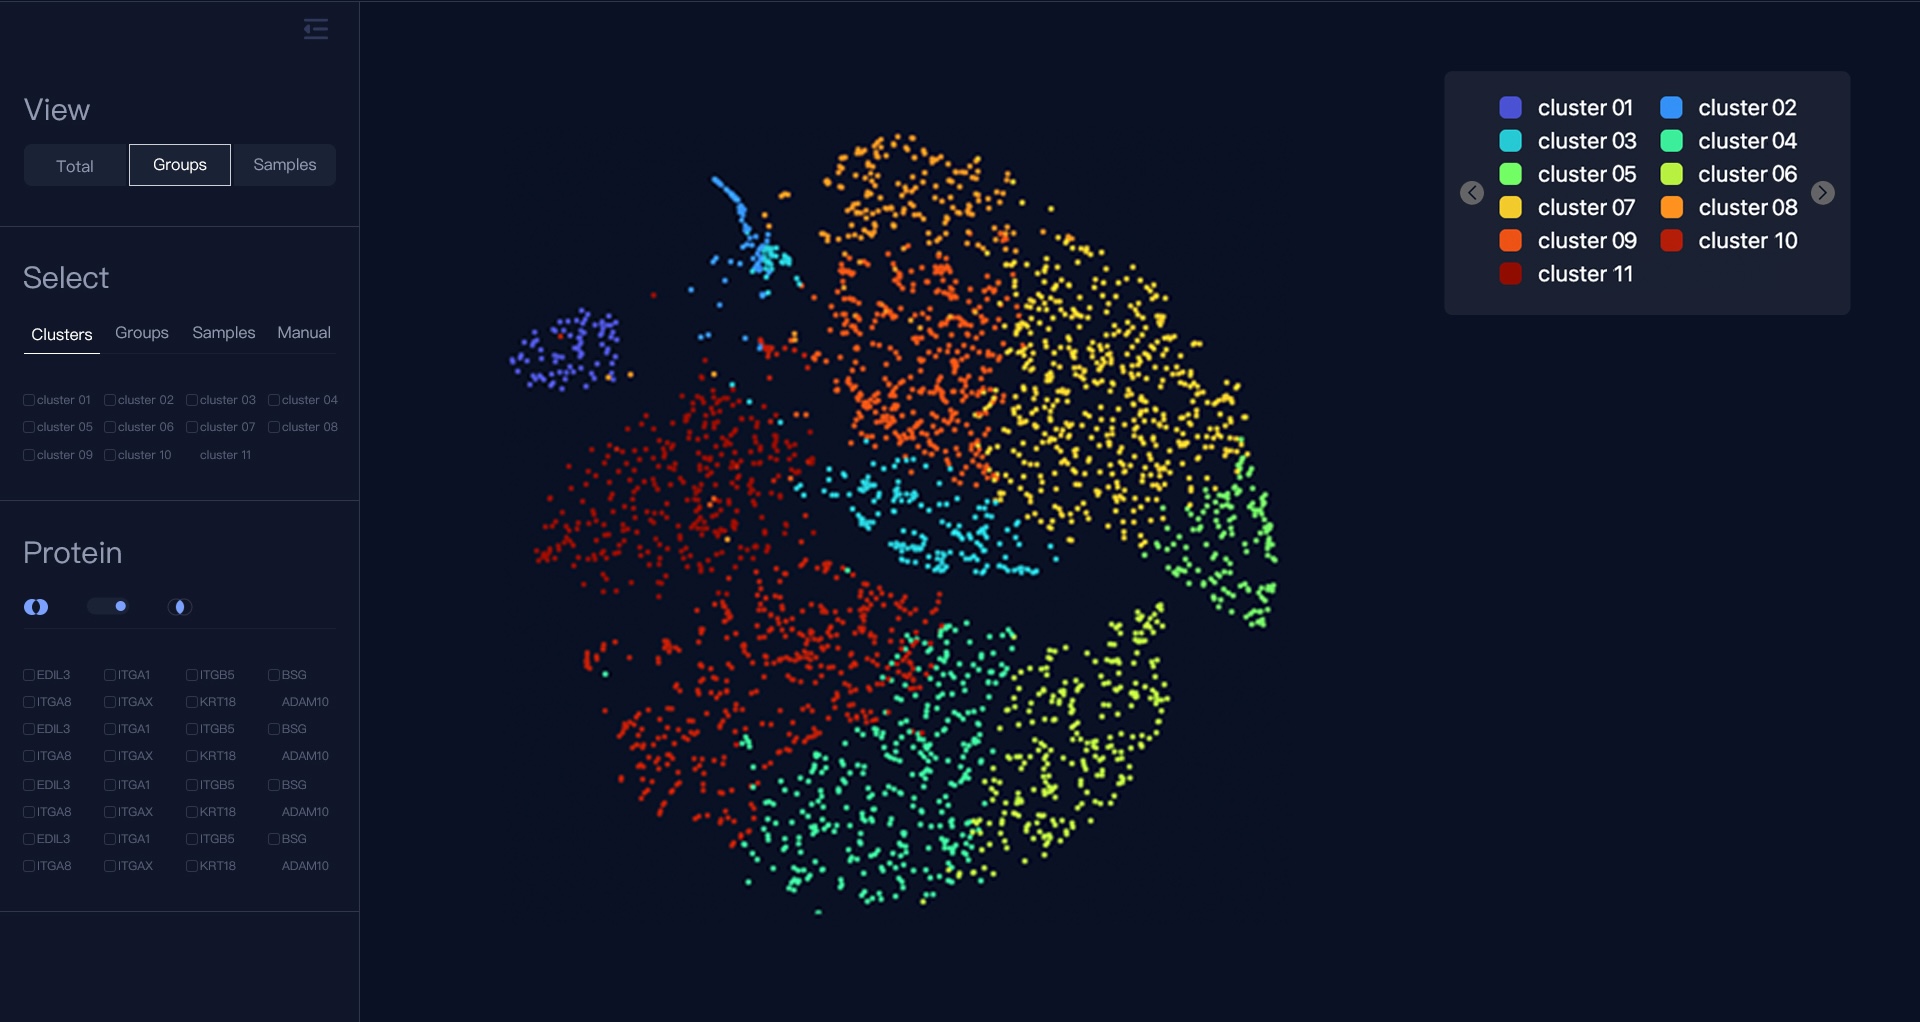
What EVisualizer® enables
Interactive visualization
Navigate PBA-derived EV profiles through an intuitive point-and-click interface.
Flexible EV selection
Select EVs by cluster, group, sample, region of interest, or protein profile.
Explore protein-defined features
Combine targets to explore EV populations with co-occurring surface-protein features.